
8DB reported 19.99M ops/s at batch size 128; the same-host campaign recorded 3.087M GET/s for Redis at pipeline depth 128. The numerical gap is substantial. Payload, key-space, exact commands and trial-selection reconciliation remain incomplete, so these are historical configuration references, not a matched competitive speedup.[1,4]
Both figures concern key-value reads: ask for a key, get its associated value. For 8DB, an omnimodal database, this May 2026 campaign exercised its in-memory binary batch path on one 32-vCPU AMD server. Original-trial and correctness reconciliation remains open.[1]
The useful engineering question is what an application can do with that path. Can it supply a batch of work, how many updates are mixed with reads, and what must an acknowledgement guarantee? The campaign's configuration history gives us a way to examine those choices.
Put the performance in perspective
For wider market context, Dragonfly published 6.43M ops/s in January 2024 on a 64-vCPU Graviton3 server with a separate, equally sized load generator. That memtier test used a different workload and network boundary, with throughput selected under a tail-latency bound.[5]
Open the original market comparison chart.
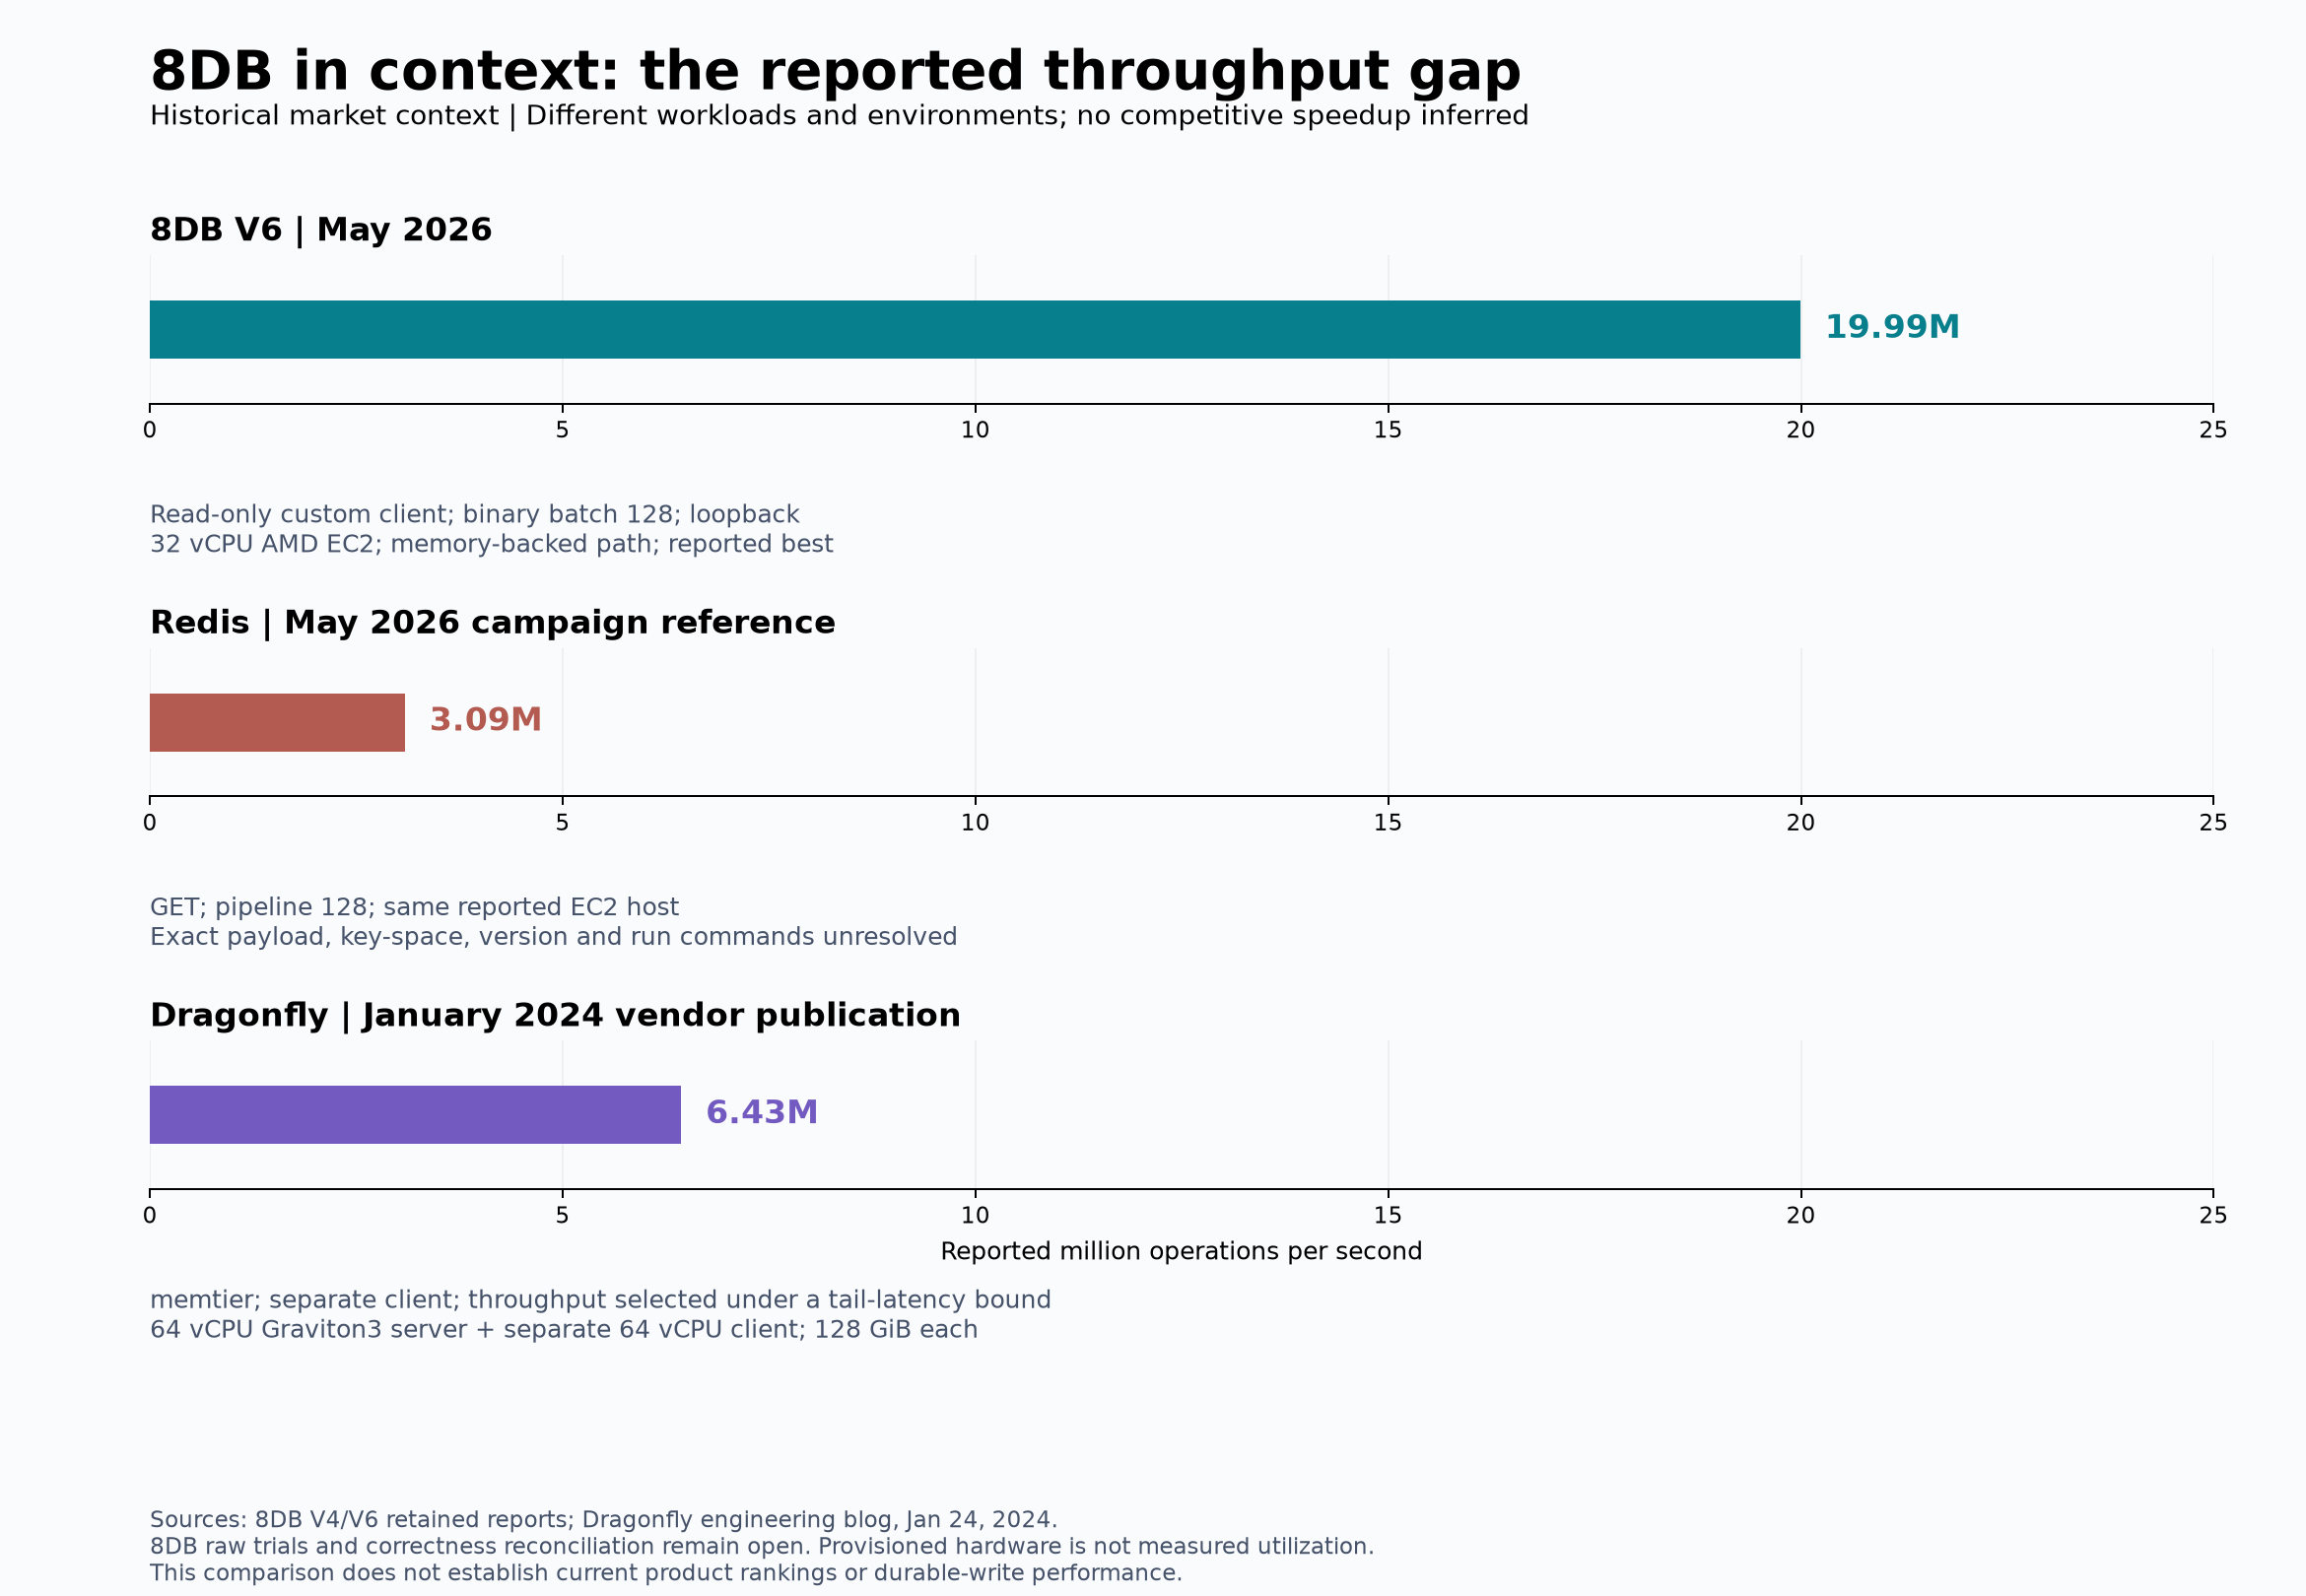
Different test contracts, shown together for context. Provisioned hardware describes the environment; it does not measure utilization or establish hardware efficiency. These figures do not rank current database products.
The practical next step is a matched comparison at the payload, concurrency and completion guarantees a customer actually needs. Redis's benchmark guidance identifies pipeline depth, clients, payload and key selection as important dimensions.[6]
The reported throughput, with its conditions
Millions of operations per second. Same visual scale; different workloads and measurement boundaries.
Read-only binary batches of 128; loopback client on the same 32-vCPU AMD server. Memory-backed path; reported best.
GET, pipeline depth 128, same reported EC2 host as 8DB. Exact payload, key-space, version and run commands remain unresolved.
64-vCPU Graviton3 server, 128GiB RAM; separate load generator. Different memtier workload, 256-byte data size; p99.9 below 10ms selection.
A workload has more than one speed
The campaign tested three familiar YCSB read/update mixtures: A targets an even split, B targets 95% reads, and C is read-only. These were exercised through 8DB's custom benchmark harness, not presented as a certified run of the standard YCSB client.[3]
In V6, the best reported batch sizes differed by workload:
| Workload | Reported peak | Operations per batch |
|---|---|---|
| A: nominal 50% reads / 50% updates | 21.30M ops/s | 512 |
| B: nominal 95% reads / 5% updates | 27.62M ops/s | 512 |
| C: read-only | 22.00M ops/s | 1,024 |
The campaign's overall peak, 27.62M ops/s, belongs to the nominal 95% read / 5% update workload at batch size 512. Keep that figure with its workload: it is a different result from the read-only comparison in the headline.[1]
Batching lets many operations share framing and transport overhead. The configuration that maximizes throughput still has to fit the application's response-time requirements. A stream processor with a queue of available work has different options from an application waiting for one user's request.
Open the original batching and revision charts. The workload peaks appear in the table above; the revision comparisons follow below.
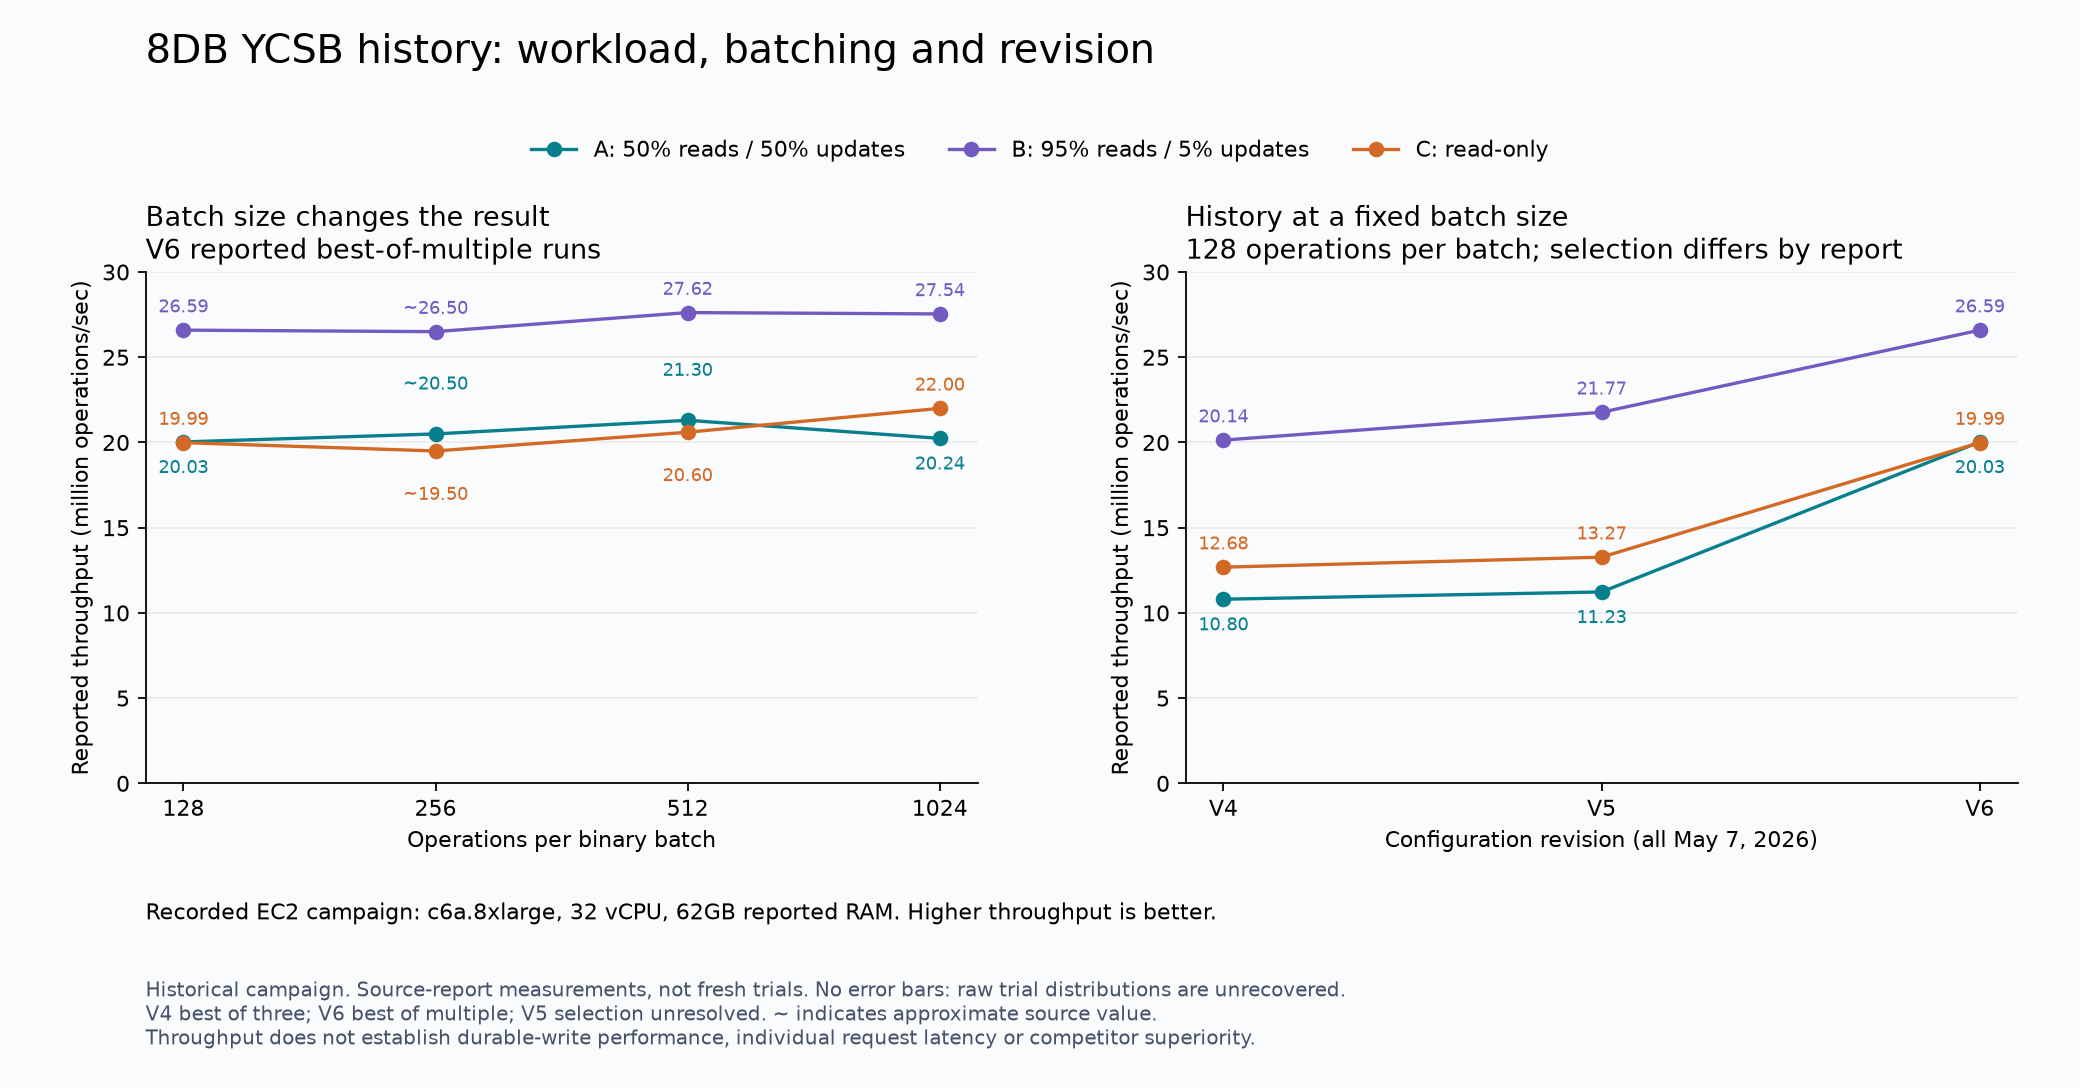
May 7, 2026 campaign, reported c6a.8xlarge with 32 vCPUs. The history panel holds batch size at 128. These are report summaries with differing run-selection rules; the figure does not imply trial-level statistical significance.
One workload, two ways to inspect its history
Batch size · V6
Million operations/sec · higher is better
Revision · batch size 128
Million operations/sec · higher is better
Follow the changes, not just the peak
At 128 operations per batch, the heavier-update workload rose from 11.23M ops/s in V5 to 20.03M in V6, approximately 78%. Read-only throughput rose from 13.27M to 19.99M, approximately 51%.[1,2]
At batch size 512, the heavier-update workload increased from 12.38M to 21.30M ops/s, approximately 72%.[1,2] These are historical reported peaks from selected runs, with the same batch size within each revision comparison.
The V6 report identifies a change to the mimalloc allocator. That is a plausible performance lever when many worker threads repeatedly allocate small objects. The historical reports associate the improvement with that revision; isolating how much came from the allocator requires the original controlled trials or a matched rerun.
For an engineering team, this is the practical opportunity: tune the path around the work it is doing. Protocol, batch size, cache behavior and memory allocation can all matter. These measurements document manually selected configurations and implementation revisions; they do not establish that an adaptive controller selected the best settings automatically.
Key-value performance is one part of 8DB
8DB is an omnimodal database, with native structures for several kinds of data. This article measures its key-value path. An application may also need to analyze activity, search for similar records or follow relationships between entities. Those surrounding operations are part of the database decision too. Explore 8DB's native modalities.
Where those requirements can share one engine, teams could reduce copied data, connectors and the work of keeping policies aligned across services. For an application serving customer activity, for example, fast key lookups and timely analysis may both matter. These are potential application benefits; this throughput campaign did not measure a combined workload or the cost of replacing a stack.
For another measured modality, see 8DB and QuestDB: time-series ingestion on an M1 laptop. It examines how quickly newly loaded data becomes queryable. The two campaigns provide separate evidence for different jobs, with their own configurations and completion guarantees.
For analytical querying, see 8DB alongside published database market references. That article separates historical timings from the potential value of serving several modalities in one engine.
Choose the finish line
The inspected 8DB revision serves this benchmark through memory-backed structures and acknowledges binary updates after an in-memory insertion. Its throughput describes that path. Durable completion, active encryption and governance need their own path-specific measurements; this campaign does not measure their cost or establish their throughput.
There is also a distinction between batch efficiency and request latency. The batch client divides the batch's elapsed time by its operation count. That is an amortized time per operation, so we are not presenting it as sub-microsecond individual-request latency.
The historical client decodes read responses but does not compare each returned value with an expected value. Original run logs and correctness evidence remain part of the reconciliation. These are promising recorded throughput results, not yet a newly validated performance guarantee.
Turn the history into your next test
The campaign makes a practical case for evaluating 8DB's batched key-value path. The next comparison should preserve what your application needs:
| If your application needs… | Hold this constant in the comparison |
|---|---|
| An immediate answer to one request | Payload, key distribution and an individual-request latency target |
| High throughput from queued work | Available batch size, client concurrency and the allowed waiting time |
| Frequent updates | Read/update mix, starting data and the point when updates become visible |
| Recovery after a failure | The exact acknowledgement and recovery contract |
These choices turn a headline into a testable buying decision. Bring us your workload with its value size, read/update mix, available batch size and required completion guarantee. We can use those requirements to define a matched evaluation and find out whether this path fits your application.
Sources and measurement notes
- V6 campaign report, May 7, 2026; best of multiple runs. Named revision
0beca88f8e6602a54d602a7ff729ec1c8ad949fa. The linked public supplement transcribes retained report cells and records source digests; it is not a raw-trial archive. Source inspection binds to this revision, not to a recovered executable hash. - V5 campaign report. Percentages above are arithmetic over reported cells, rounded to whole percentages. Raw distributions are unrecovered. Historical reports call the engine TrustDB; this article uses the current 8DB name.
- YCSB core workload definitions. Workload names alone do not establish matching data distributions, record layouts or harness behavior. The recovered campaign describes 10M records and 32 client connections; the inspected client generates eight-byte keys and 100-byte update values.
- V4 campaign report. V4 uses best-of-three selection. Redis's precise recorded value is 3,087,012 GET/s; later summaries round it. Redis versions differ between retained reports and need reconciliation. None of the cross-product figures here establishes a current-version ranking.
- Dragonfly's published Graviton3 benchmark, January 24, 2024. Maximum 6,432,982 ops/s; 128GiB server memory, separate client, 10M preloaded keys, memtier configured with 256-byte data size, selection requiring p99.9 below 10ms. This article does not assert a matched read/update mixture or payload against 8DB.
- Redis benchmark methodology. Use comparable work and completion guarantees before drawing competitive conclusions.