
On approximately 100 million rows, 8DB's May campaign reported an 18 ms filtered count on an AMD server. Published results for the same machine type show 41 ms for DuckDB, 50 ms for Apache Doris and 59 ms for StarRocks. ClickHouse's newer reference is faster, at 1 ms.
That gives 8DB a promising place in the analytics conversation. It also opens a bigger question for teams choosing a data platform: how much of the application can the same engine serve?
8DB is an omnimodal database. Analytics sits alongside its other native data capabilities, including key-value, time-series, graph and vector work. The opportunity is to meet the application's query requirements while reducing the work of connecting separate systems. This article examines the analytical evidence first, then the practical value that broader design could offer.
The numbers below are historical market context, not a matched head-to-head. 8DB's figures measure specialized server-side handlers; external figures use the faster of the second and third recorded ClickBench runs. Dates, settings and timing boundaries differ. The comparison supports evaluating 8DB, but cannot establish equivalent-work speedup ratios or an overall database ranking.
Analytical querying on approximately 100 million rows
The modality here is analytics on tabular data: filtering records and computing aggregates. ClickBench's HITS dataset provides a shared reference for this kind of work. Its full suite contains 43 queries; our recovered campaign covers ten named paths, and this comparison focuses on two.
- Filtered count, Q02: count rows with a nonzero advertising-engine identifier.
- Combined aggregation, Q03: compute a sum, row count and average across specified columns.
These two paths provide a clearer initial comparison than the campaign's approximate-distinct queries and more complex handlers whose output equivalence still needs reconciliation. This selection does not represent every analytical query shape. ClickBench workload and methodology
AMD reference environment: c6a.4xlarge
All times below are milliseconds; lower is better. Links identify the exact result artifacts.
| System | Result date | Filtered count | Combined aggregation |
|---|---|---|---|
| 8DB V8 | May 8, 2026 | 18 | 55 |
| ClickHouse | September 17, 2026 | 1 | 31 |
| DuckDB | May 11, 2026 | 41 | 74 |
| Apache Doris | May 10, 2026 | 50 | 90 |
| StarRocks | September 7, 2026 | 59 | 103 |
| PostgreSQL reference | March 10, 2025 | 258,532 | 258,521 |
The PostgreSQL entry is an older, untuned general-purpose reference with a very different result profile. It provides general-purpose context; PostgreSQL's best achievable analytics performance requires a separately tuned evaluation. The specialist comparisons are the more useful guide to the competitive question here.
Graviton reference environment: c8g.metal-48xl
| System | Result date | Filtered count | Combined aggregation |
|---|---|---|---|
| 8DB V8 | May 8, 2026 | 5 | 17 |
| ClickHouse | September 17, 2026 | 1 | 8 |
| DuckDB | May 11, 2026 | 32 | 44 |
| StarRocks | September 7, 2026 | 22 | 31 |
No qualifying result for this exact machine was recovered from the selected Doris or PostgreSQL directories. An empty position is a gap in this comparison, not a performance judgment.
Open the original analytical comparison chart.
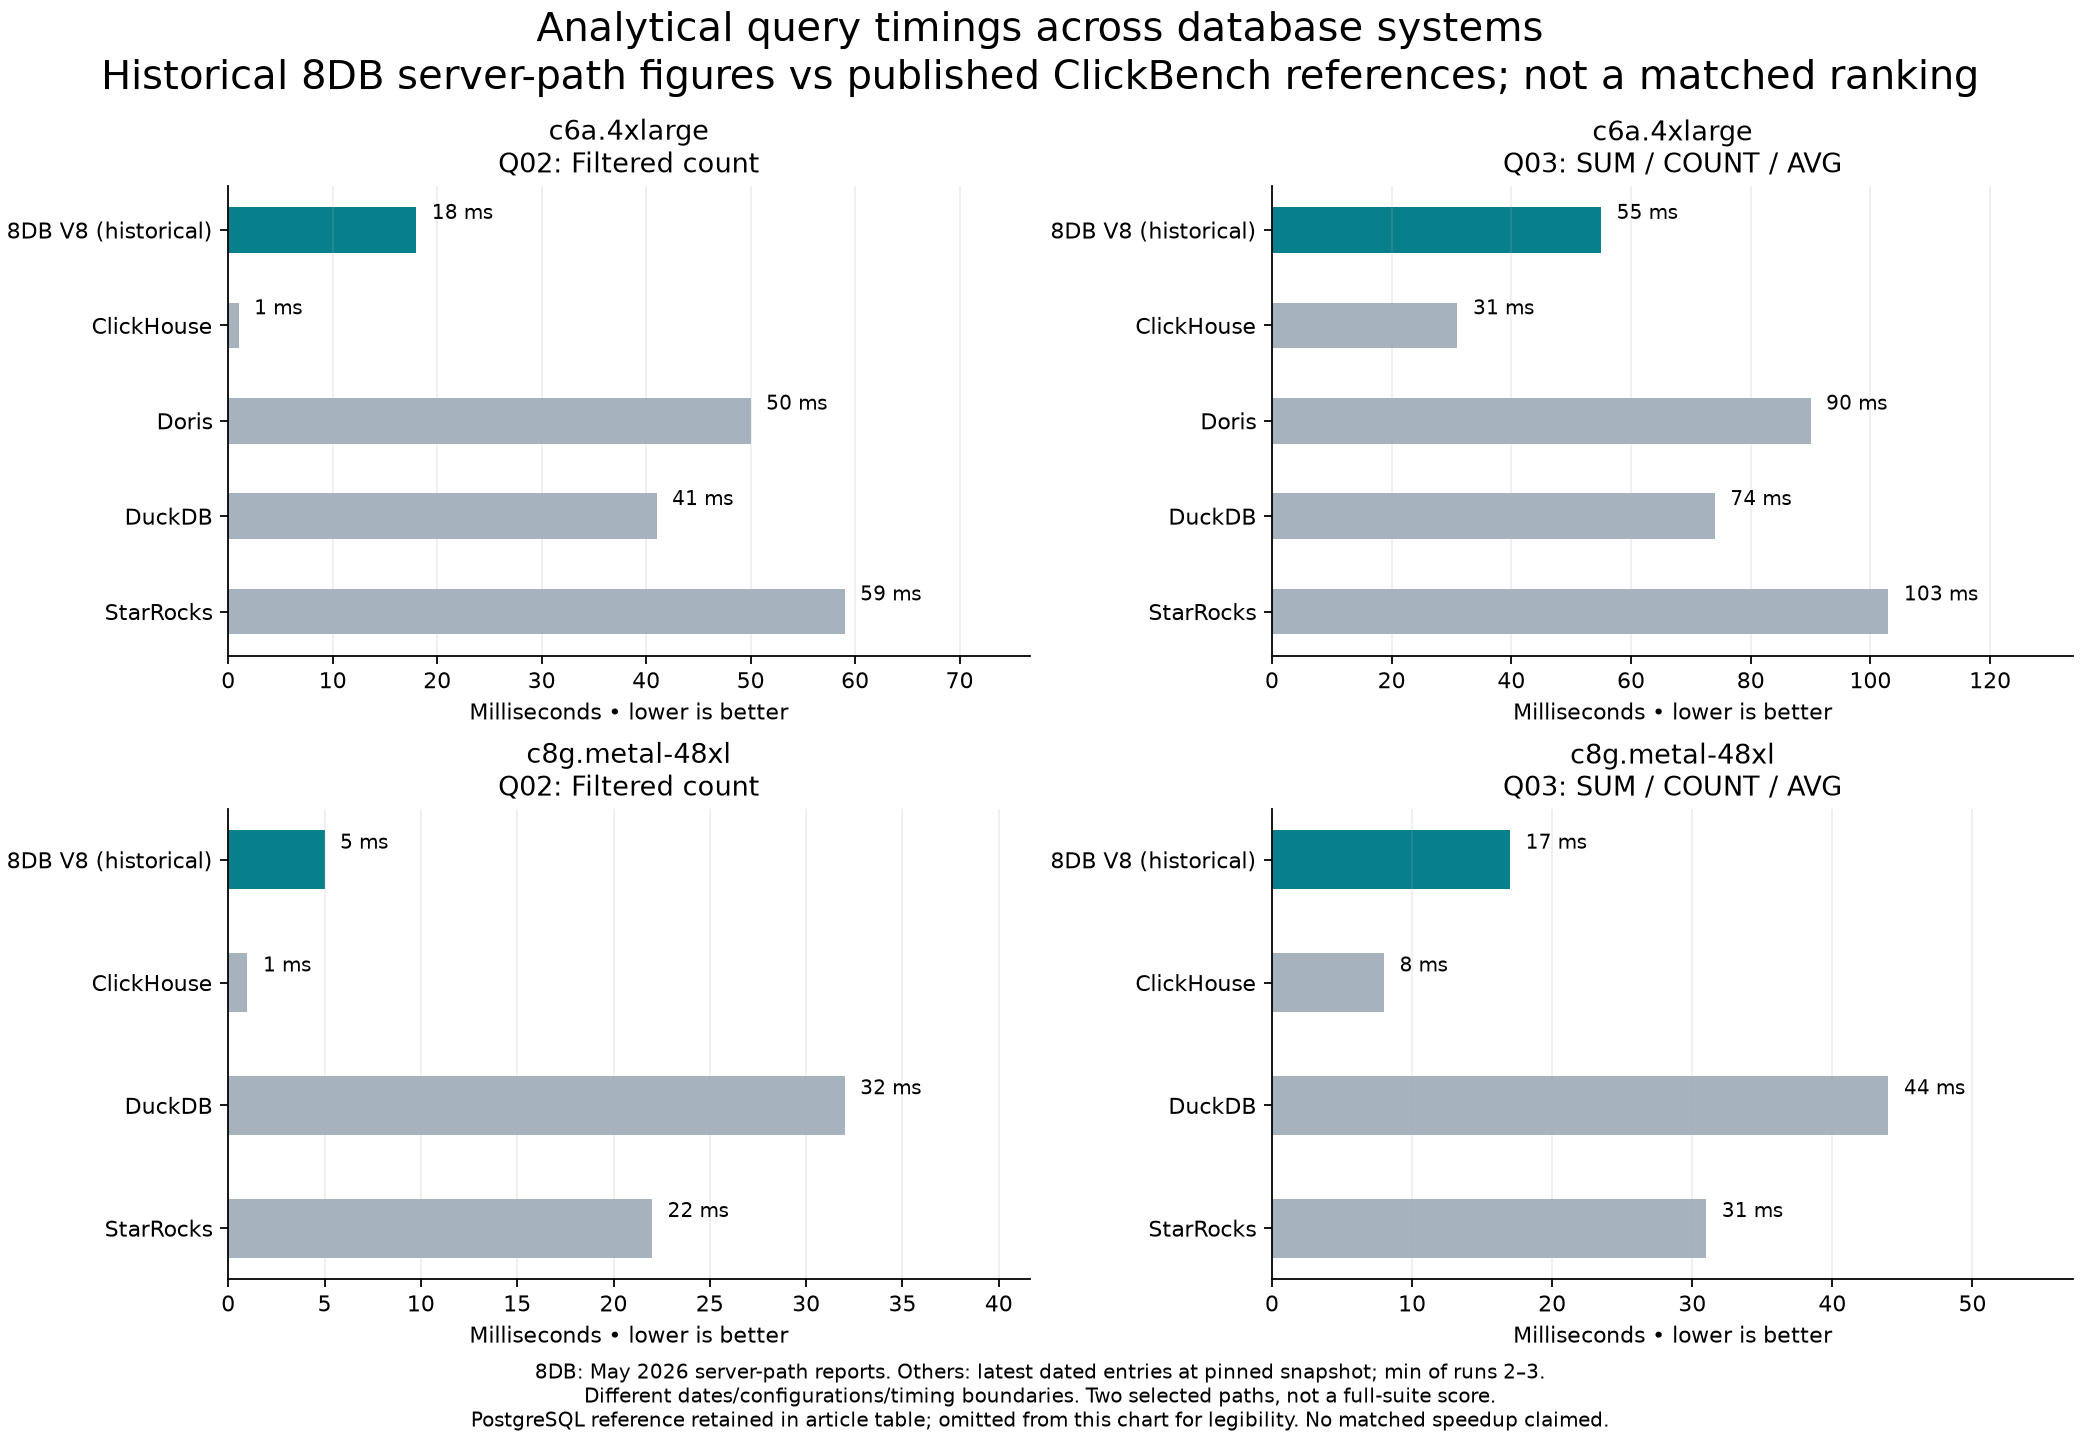
The chart uses zero-based axes and the same observations as the tables. PostgreSQL remains in the table; its much larger reference times would obscure differences among the analytical systems in this chart.
Compare one query on one machine type
c6a.4xlarge · approximately 100M rows · milliseconds, lower is better
May 8, 2026 · Reported specialized server-handler timing
September 17, 2026 · Published ClickBench: faster of runs 2 and 3
May 11, 2026 · Published ClickBench: faster of runs 2 and 3
May 10, 2026 · Published ClickBench: faster of runs 2 and 3
September 7, 2026 · Published ClickBench: faster of runs 2 and 3
Older untuned PostgreSQL reference: 258,532 ms (March 10, 2025). Retained in the table above; omitted from this axis so specialist differences remain visible.
What position does that give 8DB?
On both machine types, 8DB's reported times for these two paths are below several published specialist references. ClickHouse has the lowest figures shown. The useful conclusion is that 8DB's analytical path deserves evaluation alongside those alternatives, particularly when an application also needs other kinds of data processing.
The dates matter. The May report paired 8DB's 5 ms Graviton filtered count with a 10 ms ClickHouse reference. September's published ClickHouse result is 1 ms. Keeping both records preserves the improvement in the competitive baseline; neither comparison measures the current state of 8DB.
For a dedicated analytical workload, the fastest complete, correct answer at the required concurrency may settle the choice. For an application combining operational data, analytics and search, the decision has more dimensions.
The bigger payoff: less work between data and a decision
Consider an application investigating equipment failures. It may need to aggregate recent readings, follow relationships between components and find similar past incidents. The customer wants a useful answer while there is still time to act.
8DB's native data structures and embedded deployment approach give us a way to explore that broader job. The following are architectural opportunities, not benefits measured by this ClickBench campaign.
Fresher answers. Where analysis can use operational data directly, an application may avoid waiting for an export, transformation and reload before asking its next question. The relevant measure becomes the time from a new event to a useful answer, as well as query latency.
More context for the decision. Combining an aggregate with relationships and similarity search could help explain which incidents deserve attention. A fast count tells you how often something happened; connected evidence can help determine what to investigate. The quality of that decision still depends on the data and the application.
Less integration to operate. Where one engine can replace several services, teams could have fewer connectors, copied datasets and policy mappings to maintain. The comparison should count deployment, upgrades and recovery alongside runtime speed. Consolidation also concentrates work, so contention and failure recovery belong in the evaluation.
Deployment changes which benefit matters most. A server team may value simpler operations and fresher data. A remote gateway may value answering locally when the connection is poor. Avoiding transfers could reduce radio energy; avoiding redundant copies could reduce flash writes. Local computation, indexing and synchronization also consume resources, so battery life and storage endurance remain workload-specific opportunities for measurement.
Several alternatives offer capabilities beyond analytics, and embedding is already available through products such as DuckDB and ClickHouse's chDB. The right comparison is the actual product or stack that can do your job. 8DB's case rests on how well its particular combination works for that application.
Analytics is one part of the performance story
Other native modalities have their own evidence and comparisons:
- Key-value reads: 8DB and Redis, with the recorded throughput and configurations.
- Time-series ingestion: 8DB and QuestDB on an M1, measuring time to make the dataset queryable.
These separate campaigns broaden the evaluation. They do not establish simultaneous peak performance or measure the equipment-failure example above.
Bring the whole workload
Start with one analytical query your application depends on, its response-time target and the other data operations that surround it. Include the freshness and durability requirements that make the answer useful.
Then compare complete responses, answer correctness, concurrency and the systems needed to deliver them. A few milliseconds on one query may matter less than a delayed pipeline or an extra service to operate. In other applications, those milliseconds decide the result.
Talk to us about evaluating 8DB. Bring that query, its response-time target and its surrounding workflow. The goal is to find out whether 8DB can meet your analytical requirements and simplify the application around them.
Evidence and scope: This is a historical engineering comparison, not a full-suite qualification. External records were captured from ClickBench commit 9699b7a36a208a65028394e5f39f40e21bda2d91, selecting the latest dated entry on or before September 17, 2026, in each chosen system directory for the two machine types. The stored artifacts retain all query timings. Only Q02/Q03 are emphasized here; other recovered handlers include approximation or output-equivalence issues that prevent a defensible suite-wide score. 8DB's values remain report observations, with raw trial recovery and independent answer validation outstanding. No new database benchmarks were run for this article.